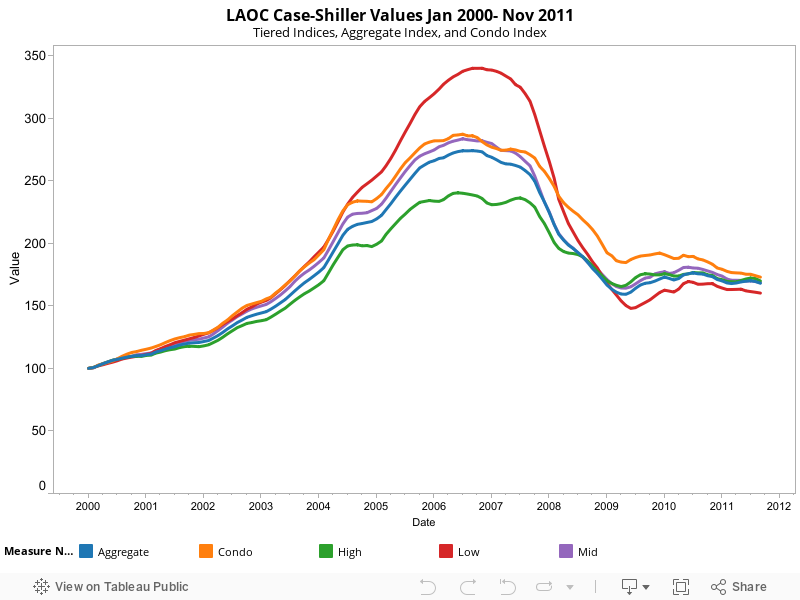
From the above chart, we can see the long term trend of home values in the Los Angeles / Orange County region. While prices have declined considerably from peak bubble pricing, prices are still elevated over pre-bubble (year 2000) levels. As data from the second half of 2011 works its way into the Case-Shiller index values, we expect to see a continued slow decline for home values.
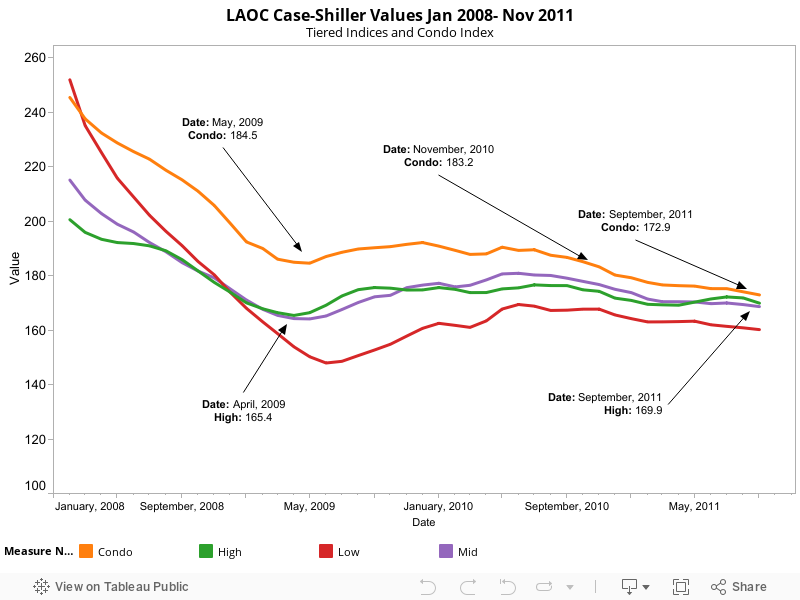
The second chart drills in on the mid-term: Jan 2008 to Nov 2011. In this second chart, we can see why there is still some debate in the real estate world about whether pricing has “double dipped”. Case-Shiller index values hit cyclical lows in the beginning of 2009, before homebuyer tax credits temporarily boosted demand and prices. Once the tax credits ended, in mid 2010, prices moved towards a new less-distored (but certainly still heavily policy-influenced) equilibruim. Naturally, this new equilibrium price was lower than the price when housing was subsidized by $8,000/buyer. The tax credit was ultimately a “suckers” deal, where 2010 buyers got bilked into overpaying for housing (and property taxes). In fact, most 2010 FHA 3.5%-down buyers in Los Angeles and Orange County are now underwater homeowners.
The Case-Shiller Condo index for Los Angeles Orange County shows a different result. While the index value did bottom in early 2009, its rise was more modest thereafter. That index then hit a new cyclical low in Nov 2010 and continued lower from there. Condo values are now 6% below the early 2009 temporary bottom and should continue lower in the coming months.